The Early Success of the NFL Data Consultants Win Rating System

Braden Abshire of NFL Data Consultants finished development of a rating system similar to the QB Rating and ESPN’s QBR rating systems. The NDC Win Rating system was superior by about 3% on ESPN’s QBR and 8.5% on the NFL’s QB Rating. It was also superior when compared to some other variations of rating systems out there. It tested at over 96% in the test set, and was validated at over 88% when tested on over 3200 NFL Games.

The NDC Win Rating system provides a rating for each side of the ball, and then the differential is the final team rating. In the NFL, 10 of the top 11 teams made the playoffs. The lone team to miss from that group was the Buffalo Bills, who finished ranked #9 in the NDC Win Rating and had 9 wins on the season.

The NDC Win Rating System is a useful tool in other areas. It can be a beneficial tool for strategy, gameplanning, and decisions. It can also identify under the radar coaches at the NFL or NCAA levels. This is a useful tool for NFL organizations and NCAA schools that want to interview rising candidates in the coaching ranks. Please note that this is only a tool as the selection of a coach also depends on organizational fit, but it can help determine the coaches that are worth talking to in order to determine fit with your football organization or program.

In following how the NDC Win Rating system would work at the College Football Level, the results have been incredibly strong with the NDC Win Rating system. The top 7 teams using seasonal ratings all won their bowl games, and teams #8, #9, and #10 all lost to top 7 teams. Ohio State was #1 and Oregon #3 heading into the games. Oregon has a large gulf between their offensive and defensive ratings, finishing #1 in offense, #54 in defense thus creating a gulf score of 53. Ohio State is #3 in offense, #8 in defense with a gulf score of 5. Like standard deviations, this suggests that Ohio State is more consistent, but it also suggests that Oregon has more pressure to hold their offensive rating or to significantly lift the defensive rating in the upcoming game.

Oregon entered the game with a +26.58 rating differential over Florida State. In the game itself, Oregon finished +35.67. Ohio State entered the game with a +17.16 differential advantage on Alabama for the season. In the game itself, Ohio was +12.67 over Alabama. At halftime Ohio State was +18.66 despite being down by a point. Please feel free to follow NFL Data Consultants on Twitter.

NFL Data Consultants is looking for a sponsor for the NDC Win Rating System. Please contact me if you are interested.
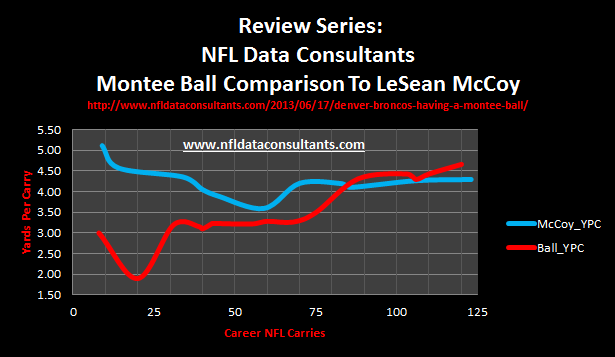
Review Series: Comparing Montee Ball To LeSean McCoy

When NFL Data Consultants used a comparison of Montee Ball to LeSean McCoy in the opening of a series of projections last summer, it was done for three purposes.

  • It was to highlight the power of analytics and forecasting of personnel in a billion dollar industry. Rookie deals are the best salary cap bargains so why not devote resources to player forecasts as an additional decision tool?
  • It was to compare to others using an analytical approach. Montee Ball was heavily attacked on other analytical players. He was repeatedly stated to be too slow or just another Wisconsion RB. With NFL Data Consulants rules/methodology/metrics, these were able to be dispelled. Montee Ball had 50 less carries than Gio Bernard and had just as many 20+ yard runs and 1 more 40+ yard runs. Montee Ball had an amazing 29.2% of his carries go for a first down. That was better than Eddie Lacy, Le’Veon Bell, Zac Stacy, Giovanni Bernard, and Andre Ellington. The objective of the game is to win and moving the chains is critical.
  • It was also put out there to be graded and reviewed because we name this project “The Win Project”. That is why NFL Data Consultants measures and compares and grades ourselves. It is just the tip of the iceberg of the ideas that NFL Data Consultants has in store for an organization that fully embraces this approach and is willing to commit to a team to carry the more advanced ideas out.

Graphed below is first 120 carries of Montee Ball compared to the first 123 carries of LeSean McCoy. This does not factor in age, but Montee Ball’s 2nd half jump correlates with the jump that LeSean McCoy saw in his 2nd year. Montee Ball is a little older than what LeSean McCoy was during his rookie season. McCoy averaged 4.11 ypc as a rookie, and then it jumped to 5.22 yards per carry in his second season. After his first 120 attempts, McCoy topped out at career average of 4.98 ypc at just past 525 carries at 23.33 years old. McCoy’s surge began near 140 carries in and continued until around that 525 mark. Montee Ball’s last regular season game was at 23.07 years old and he sits at 4.66 and averaged over 6 yards per carry over his last 6 regular season games. Montee Ball is still trending up after a slower start, but was clearly the better runner in the Denver Broncos backfield. Knowshon Moreno averaged 4.31 ypc and had only a 22% first down percentage.

Montee Ball versus LeSean McCoy

Review Series: NFL Data Consultants Comparison of Montee Ball to LeSean McCoy

If you are an organization seeking to draft a RB, this type of projection analysis can work as a tool for your decision makers. NFL Data Consultants uses enough metrics to fill an NCAA tournament bracket for RBs.

If you are an organization considering an early round Quarterback, this article on the odds of selecting a franchise Quarterback is worth the quick read.

The Odds Are Stacked Against NFL Organizations Drafting A Franchise QB In The First Round

If you are in need of a Quarterback, it is important to understand whether the ones that fit your system are capable of consistently winning at the next level. The sad nature of the NFL is that if you don’t have a reliable Quarterback, your job will always be in jeopardy. Under 20% of Quarterbacks taken in the first round since 1998 have a career QB Rating of >=90 and a QB Rating of 90 is the threshold for a QB to make the playoffs consistently with a league average defense or better. The question for the organizations selecting a Quarterback in this draft class, especially in Round 1: will you obtain one with a good chance to beat those odds that are already stacked against you? They only get harder the later you draft a Quarterback. You are lucky if there is one that will have at least a career 90 QB Rating in a given class, yet current draft projections show the possibility of 4 potential Quarterbacks chosen in the first round. Only the 2004 QB Draft class had more than 1 first round QB in it to surpass a career QB Rating of 90. NFL Data Consulants has Analytical QB Career Forecasts on around 150 Quarterbacks available. Now you know why we are confident when writing this on the Philadelphia Eagles Quarterback Situation and this on the New York Jets Quarterback Situation

You can go here to contact me for Quarterback Analysis.

An Extensive Analysis On The Houston Texans Quarterbacks: Matt Schaub, T.J. Yates, And Case Keenum

This article is in place to demonstrate the difference between an emotional and analytical approach. Fans often have an emotional approach, and the Quarterback situation for the Houston Texans verifies that. NFL Data Consulants will show clear data that will show a much clearer analytical picture. I will highlight the analytical outlook of Matt Schaub, T.J. Yates, and Case Keenum.

Matt Schaub has a lot of Texans fans upset, but that is because they don’t see the full picture. Schaub has posted seasonal Quarterback ratings of 92.7, 98.6, 92, 96.8, and 90.7 leading up to this year. Since Quarterback Rating differential correlates highly with wins, it is obvious that these are very good QB Ratings for the offensive side of the equation. The question then becomes, is the 78.8 this season his reality or is it an outlier? As stated in the New York Jets analysis of Mark Sanchez and Geno Smith, this analysis is performed using a combination of analytics and neural network/machine learning methodology. This allows for groupings of very similar characteristics and football DNA that the human eye cannot see. It also absolves the human bias. Using nearly 900 QBs and only using data before entering the league, I have been able to establish Quarterback groupings that provide a picture of a Quarterback’s future. What will be amazing is just how close Schaub’s career Quarterback Rating is to his analytical group.

Now that we have seen Matt Schaub’s group, there is two things to note. First, Philip Rivers was in a two year slump himself. Second, that is a fine group to be associated with and Schaub has lived up to the comparison group with his career performance.

So, when the fans were cheering the Matt Schaub injury, just what were they getting with T.J. Yates. Lets look at his comparison group.


Wow, now look at the difference between that comparison group and the comparison group of Matt Schaub. It is night and day. The Houston Texans have no business replacing Matt Schaub except for injury. We have to look at the Case Keenum group to get a good comparison to see which Quarterback should be playing in the event of injury.


Case Keenum’s comparison has a mixed bag that includes high upside, but also a first round bust and an undrafted QB that left the league to go coach before ever playing a down in the NFL. Because of the upside, Keenum needs to be the #2 Quarterback on the depth chart. While the Scouting Department should be congratulated for landing his upside at such as steep discount, QB Case Keenum should be playing only under one of these three circumstances:

1) Matt Schaub is injured or

2) The Houston Texans have been eliminated from the playoffs or

3) The Houston Texans are in a blowout game (ahead or behind)

Head Coach Gary Kubiak and the Houston Texans Coaching Staff have gone with the right Quarterback with Matt Schaub set to miss time with his injury. The analytical approach is pretty strong and clear on who should be taking the reigns when Matt Schaub is not available. The Houston Texans organization has a lot of class, and it is an organization that I respect very much.

What To Make Of The Philadelphia Eagles Draft Selection Of QB Matt Barkley?

When the Philadelphia Eagles traded up to the first pick in the 4th round to select QB Matt Barkley, what did they know that all other teams did not?  Head Coach Chip Kelly is known for being an outside the box thinker, and if that translates to good personnel decisions, it will be great for the Philadelphia Eagles fan base.  Matt Barkley’s Quarterback analyical profile was the best in this class according to NFL Data Consultants.

Yes, it is the human bias in us all that would have to do a double take on a USC Quarterback.  My own human bias had me do a study comparison of him versus the other previous USC Quarterbacks, and there are some things that clearly demonstrate that he is different.  Even though he is NFL Data Consultants best Quarterback of the 2013 NFL Draft class, he may not even the best long term QB on his own roster.  Nick Foles was a Quarterback that I was very high on after an analysis that I did last year comparing him to an elite NFL QB; while he did not get a benefit that the comparison QB did, the other side of that comparison remains incomplete for now.  Regardless, the sooner that the Philadelphia Eagles move on from turnover king, Michael Vick, the better it will be long term for this organization.

Although the analysis is incomplete on Nick Foles, it is interesting to note the following quote from Reuben Frank of CSNPhilly.com: “Foles last year became the first rookie in NFL history to throw for at least 240 yards per game while completing 60 percent of his passes.” Both young QBs compare to Pro Bowl Quarterbacks and the position looks bright for the Philadelphia Eagles for the long term.